Turn Your Air Into Reliable Water

How much water will the Origen Wellspring AWG produce at your site?
Every AWG manufacturer touts an output figure, but that number only holds at laboratory test conditions. We know you need real-world data to make the best choice for your project. By overlaying 30-year climate normals across North America, you can see how much water the Wellspring will yield on your site over an average year.
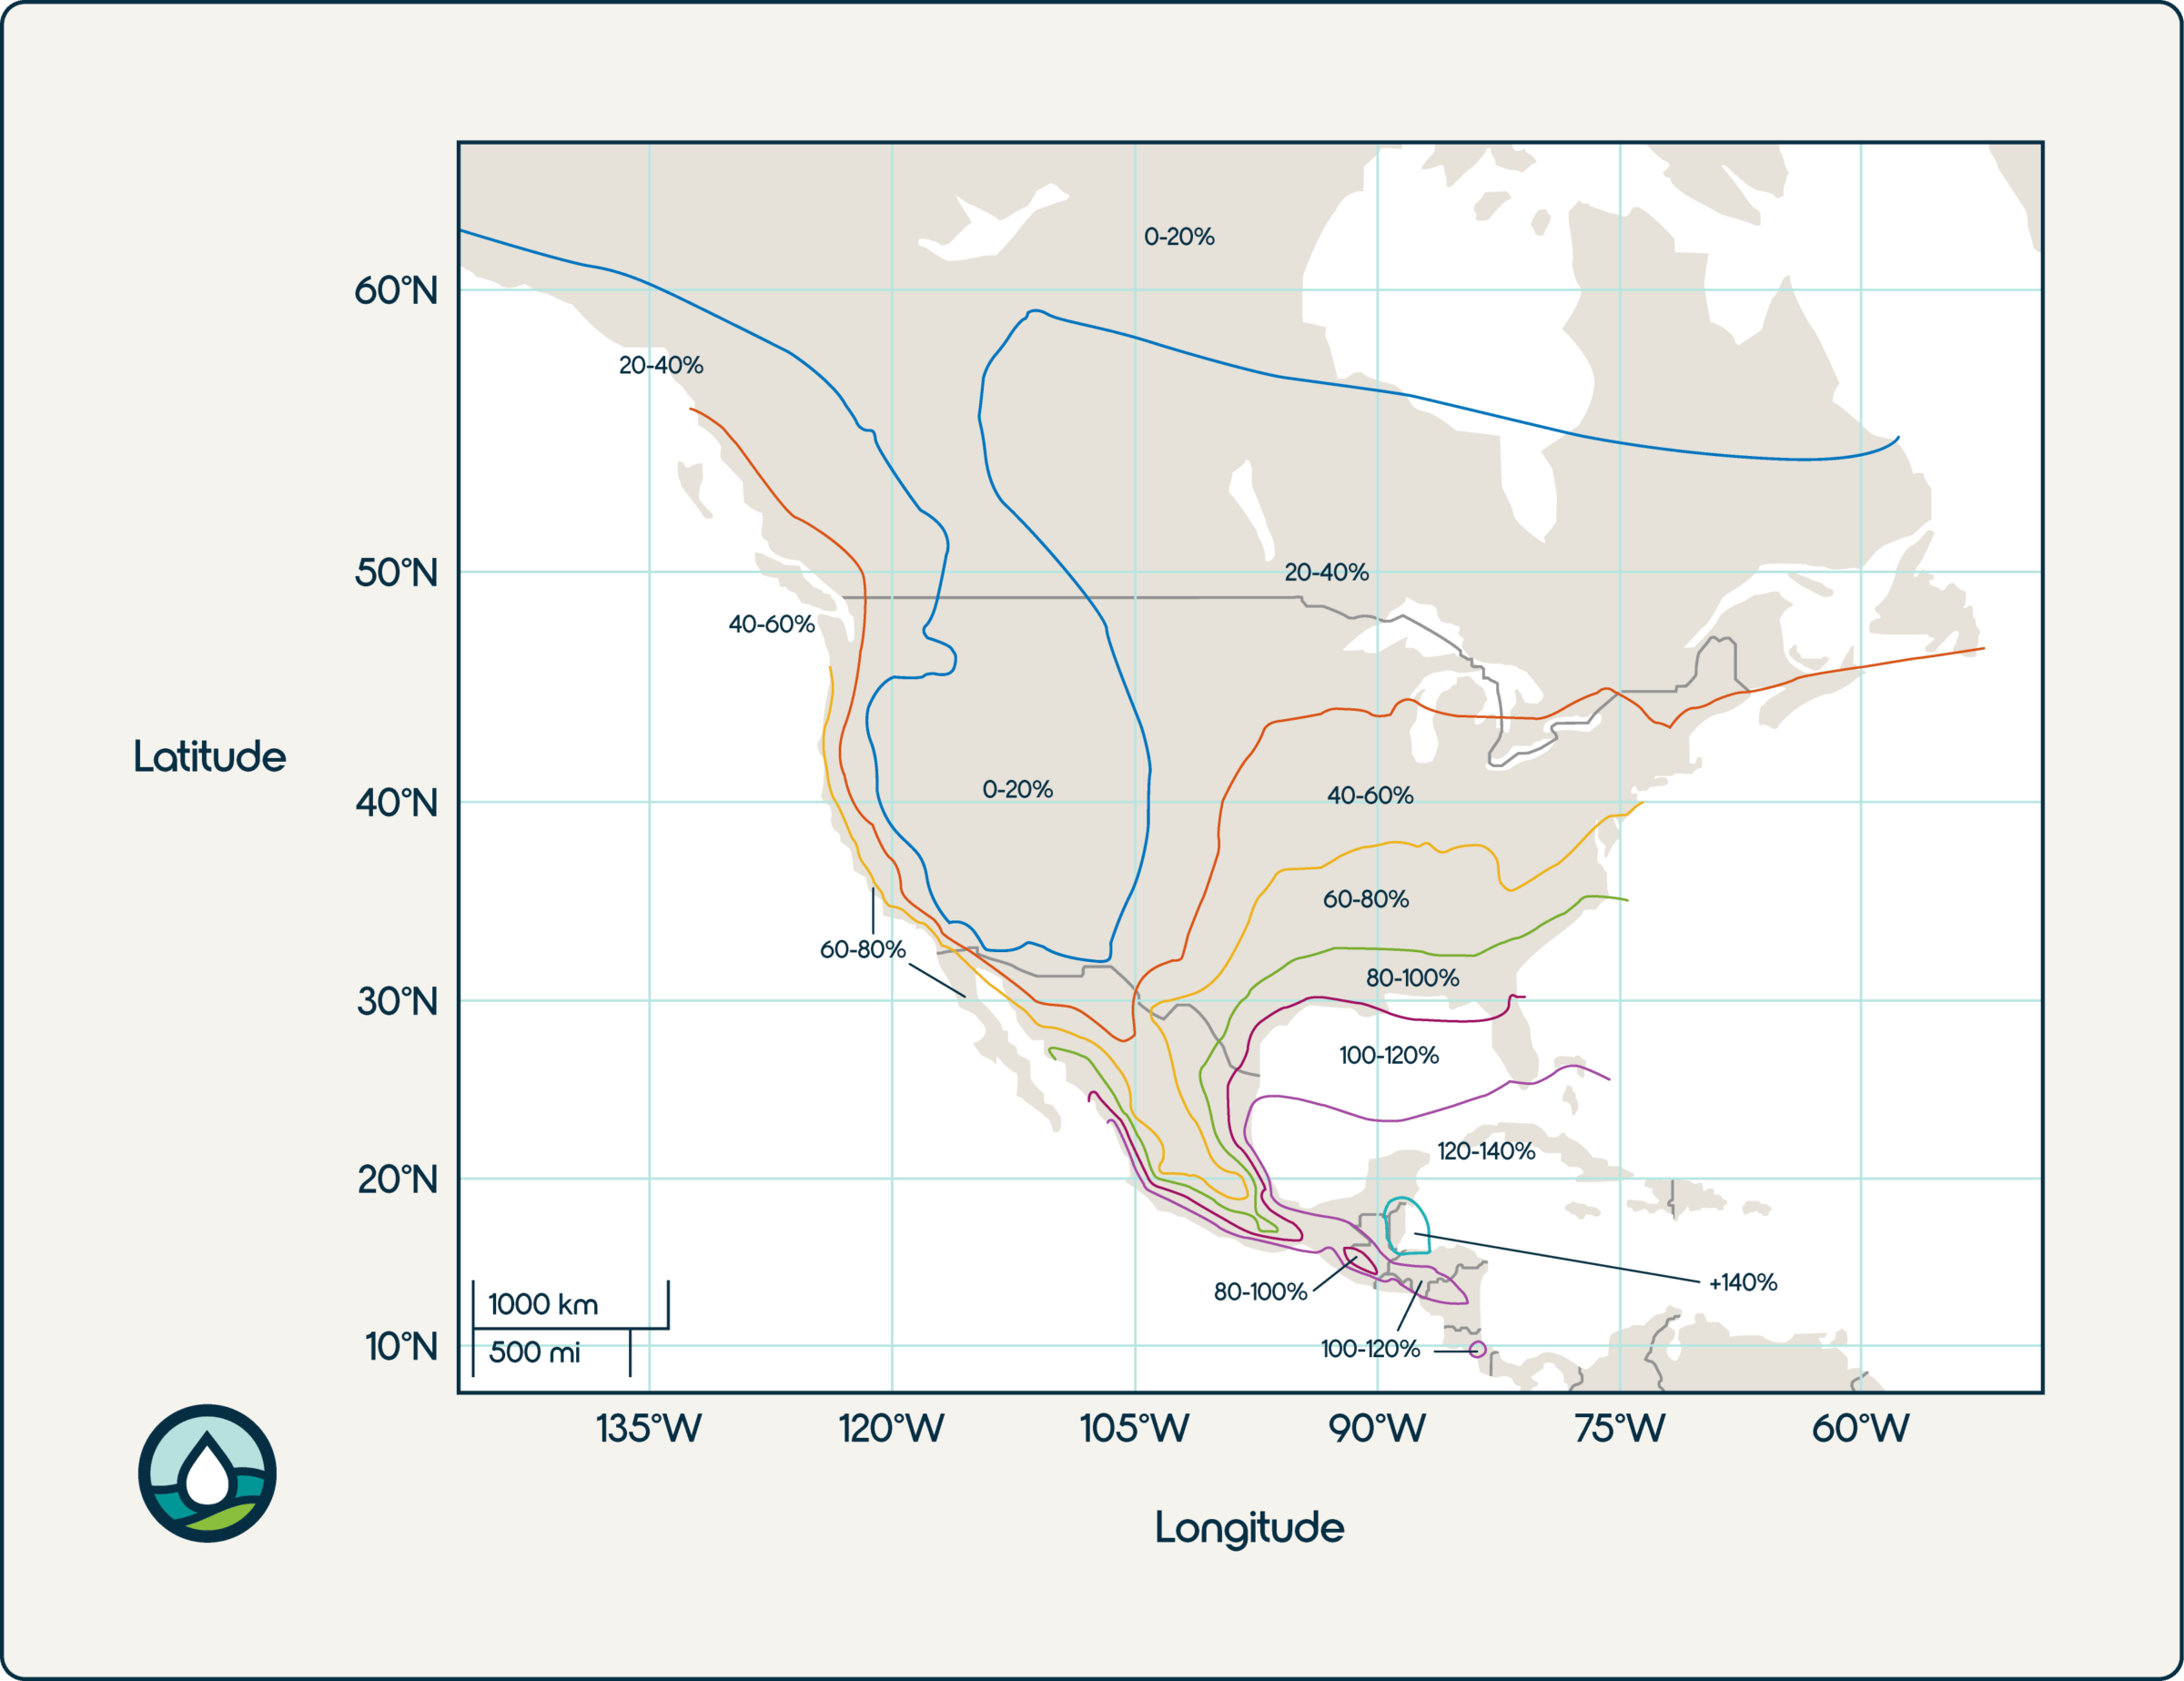
How to read the Origen AWG Map
- Test Point: 80 °F (27 °C) / 60 % RH
- Rated Output: 824 pints = 103 gal (235 L) every 24 h
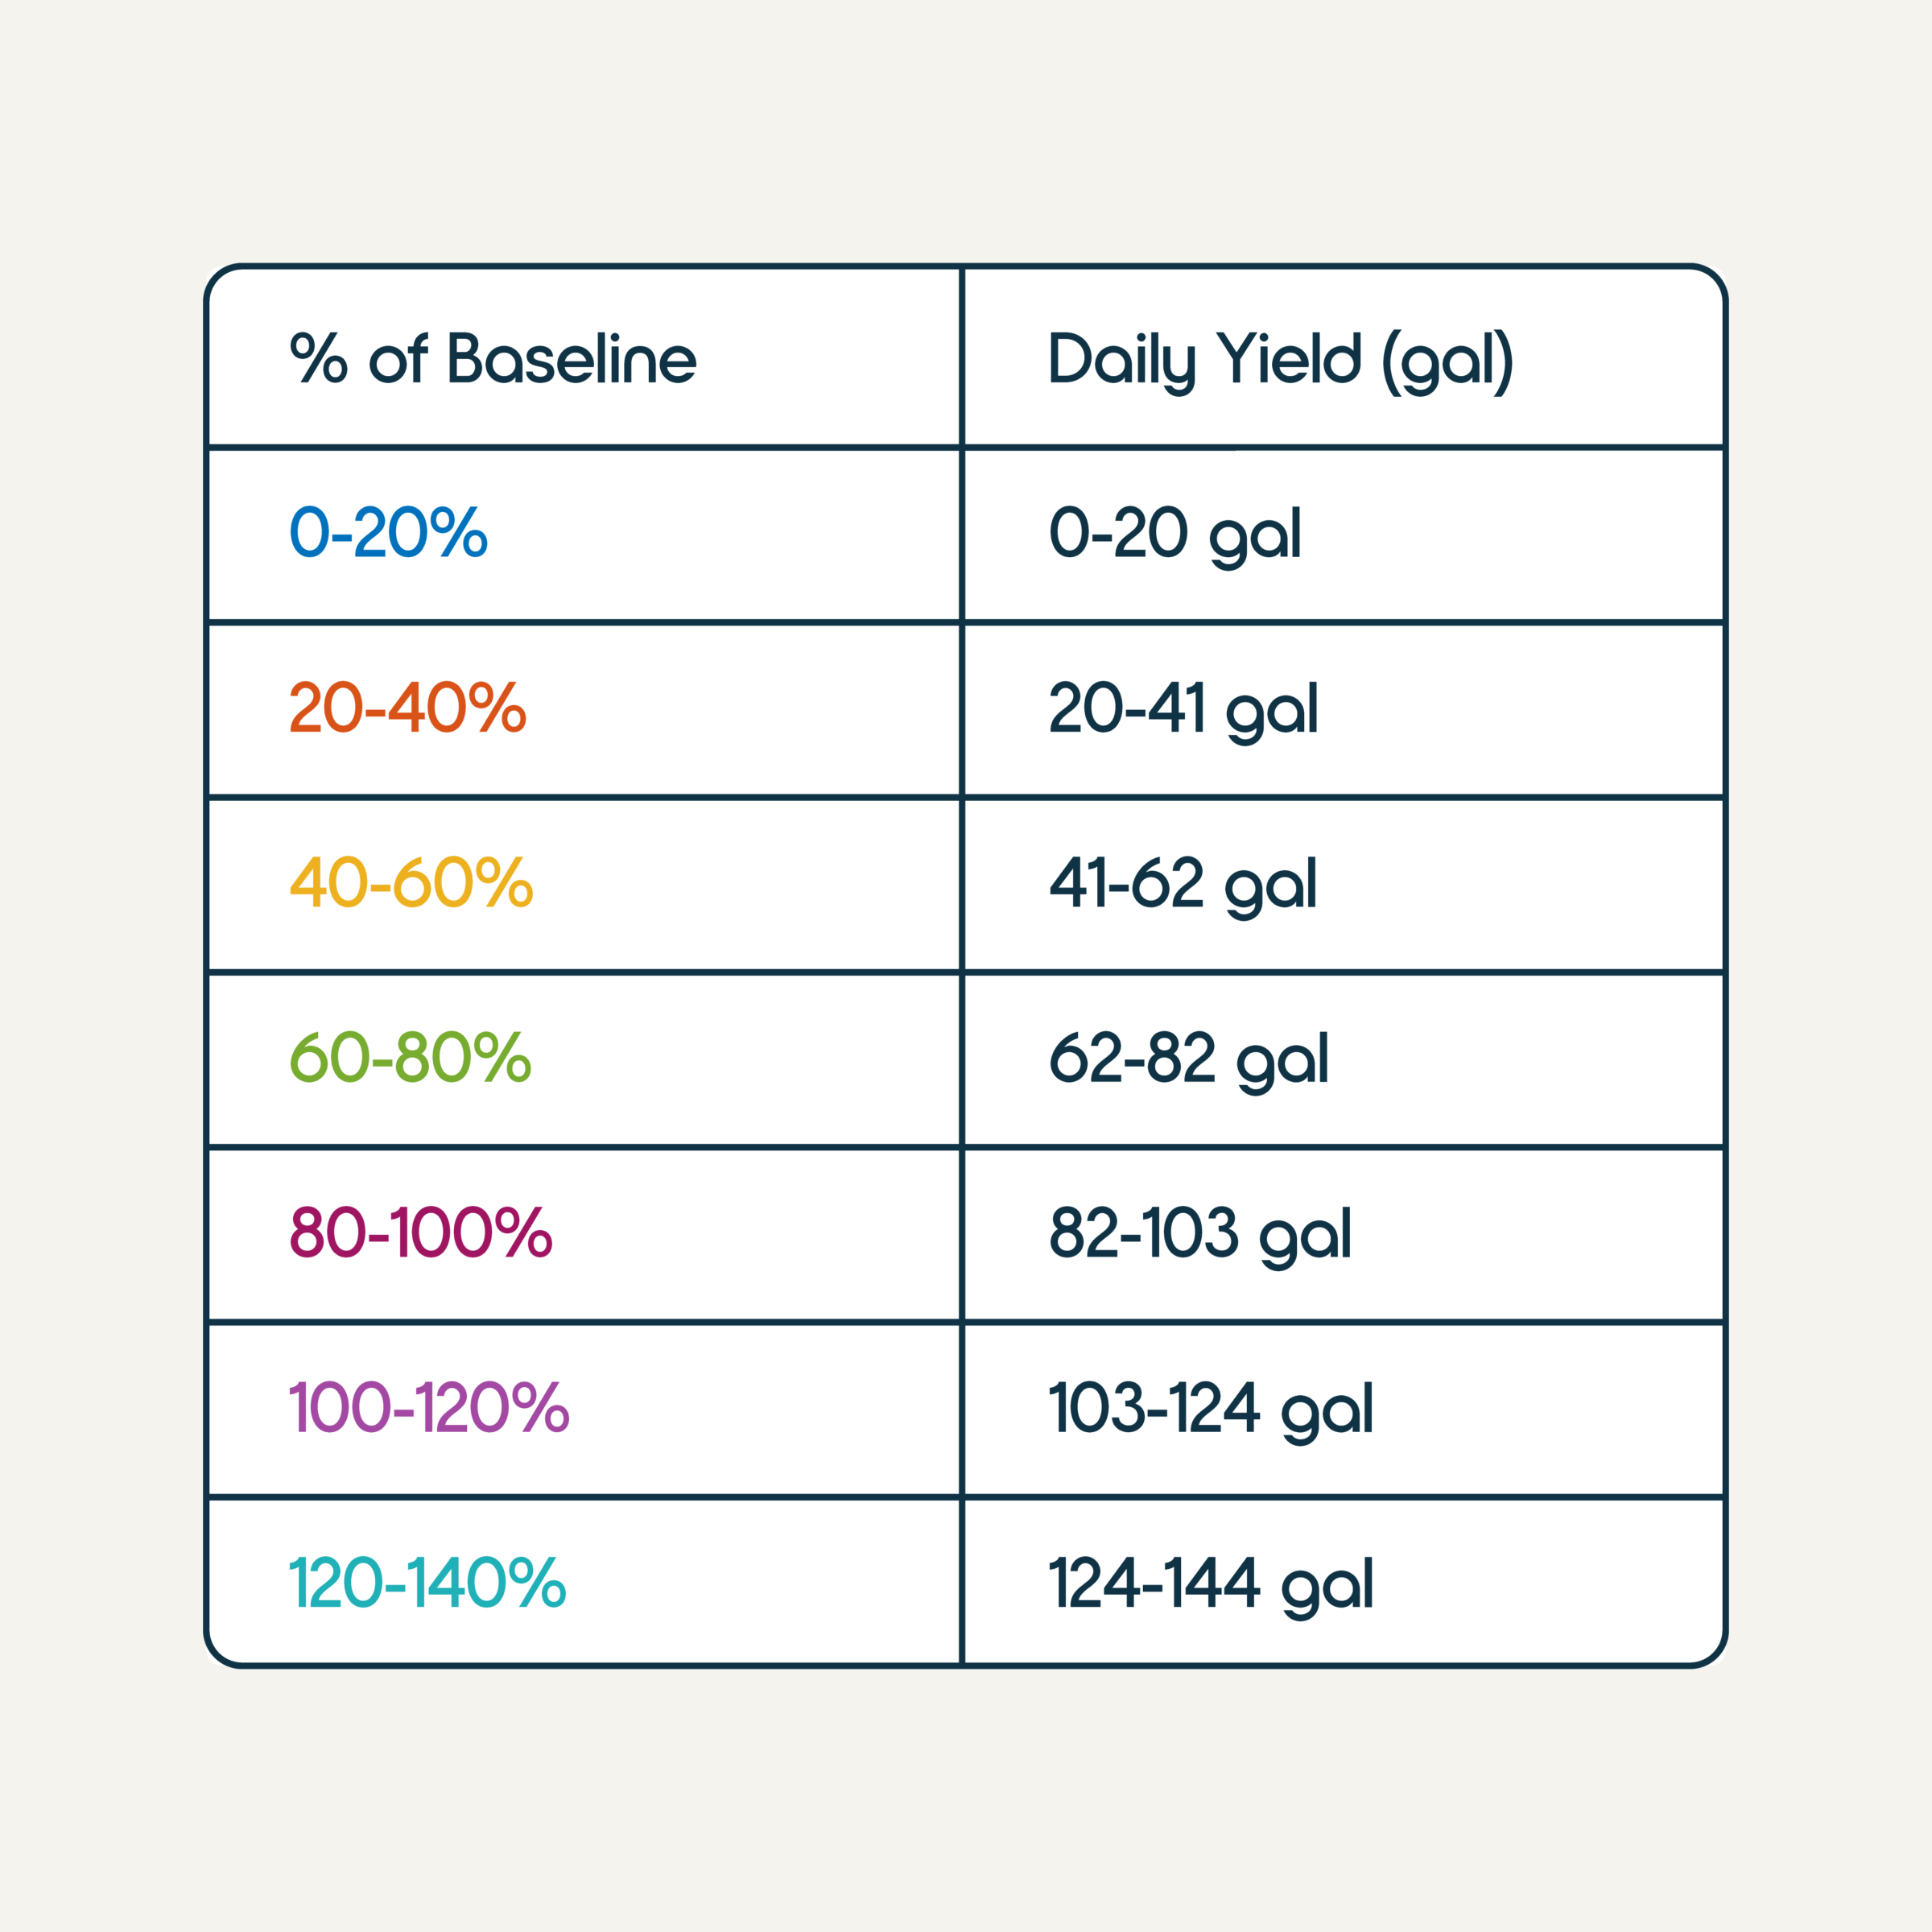
The Wellspring’s baseline output is measured at 80°F / 60% RH conditions. The map expresses all other climates as a percentage of that 824-pint baseline so you can convert color bands into clear gallon numbers.
Because the data are annualized averages, short cold spells or summer humidity spikes cancel out, giving you a planning-grade, year-round expectation.
What the Origen AWG Map Tells You
- Immediate Feasibility Check – Find your region, read the band, and know within seconds if on-site water is worth pursuing.
- Faster Procurement Cycle – Skip the back-and-forth spec guessing; our map gives you a data-anchored starting point.
- Predictable Payback – Annualized yield + sub-0.5 kWh / gal means operating cost models don’t implode halfway through the fiscal year.
- Credible Story For Stakeholders – Show facility owners, ESG auditors, or donors a clear visual of impact—no PhD in psychrometrics required.
Why Output Moves With The Weather
Warm air carries more moisture; every 10 °F jump doubles its water-holding capacity. Relative humidity piles on: a 10 % RH rise boosts condensate by roughly 30 %. The Wellspring’s oversized evaporator, variable-speed fans, and smart dew-point control squeeze that vapor out with < 0.5 kWh per gallon at the 80/60 test point.
Annualized ≠ Uniform—And That’s Okay
Daily production oscillates—Miami may swing from 140 % in late August to 90 % on a rare cold snap. The map averages those highs and lows so your CAPEX, storage, and payback math use a single, credible figure.
Need Mission-Critical Accuracy?
If the map puts you in the Green band or better, odds are good an Origen AWG can replace—or sharply reduce—truck-delivered water. Fill out the form below, tell us your address, and our engineers will deliver a custom yield report plus a line-item ROI within three business days.
Talk To an AWG Specialist
Water scarcity won’t solve itself—let’s see what your air can do.